


EverSmart Clean
Clean where people have actually been
Fixed cleaning schedules over-service empty spaces and under-service the busiest ones. EverSmart Clean converts occupancy into a live task list, then documents what was done.
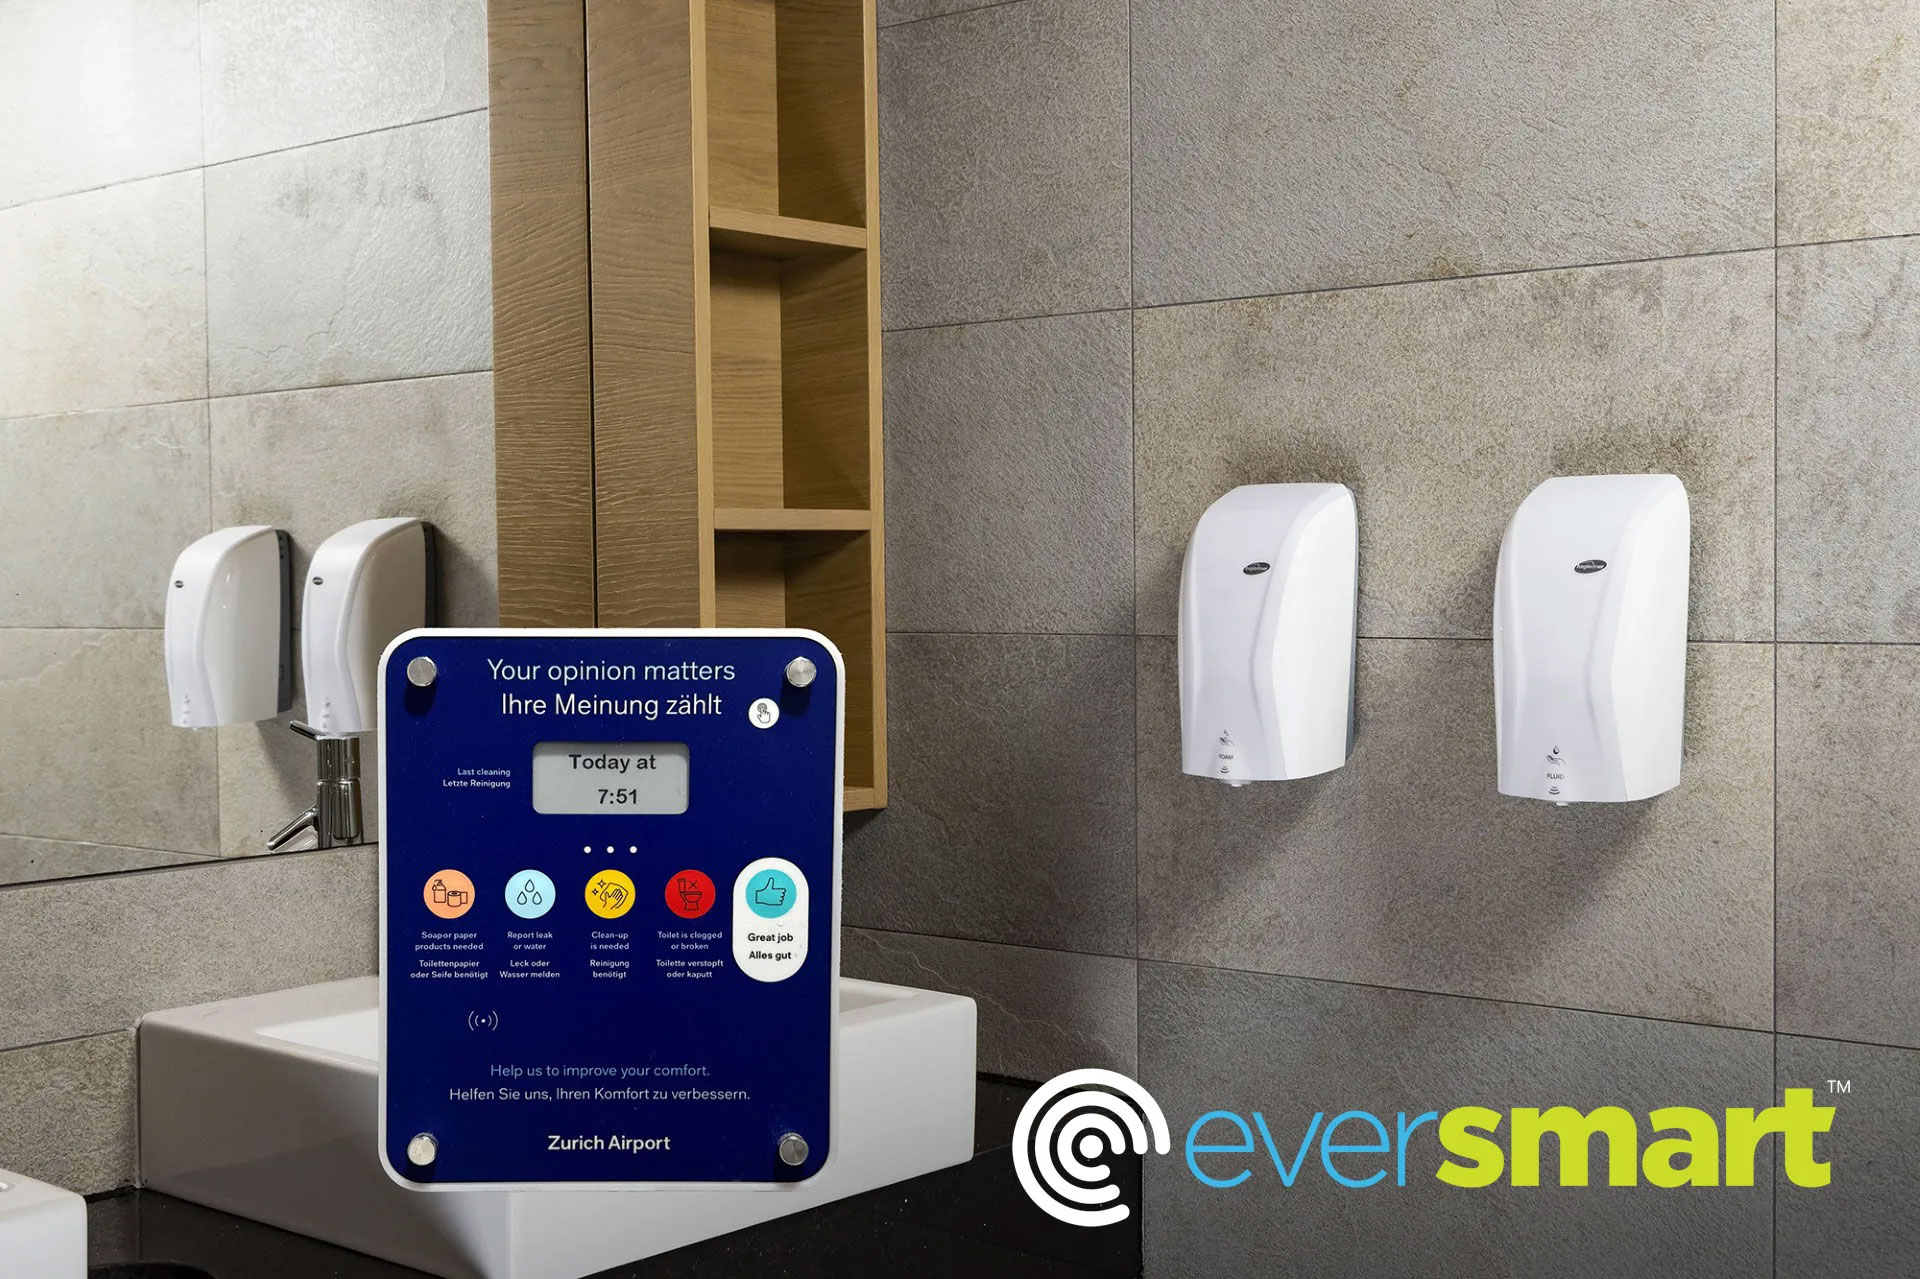
EverSmart Clean helps maintain clean washrooms and other spaces based on actual usage rather than a fixed schedule.
AI-filtering and dynamic algorithms produce 24/7 data that is time-stamped and actionable. Alerts and pattern recognition send the right message to the right person at the right time. The days of empty soap or toilet paper dispensers for your customers and employees are over.
Deployed in stadiums, concert venues, hotels and major transportation hubs globally, including Zurich Airport, it mitigates a key reputational risk and boosts customer loyalty while helping you enforce brand standards.
IMPROVE VISIBILITY AND RESPONSIVENESS: The ability of staff to clock into a space that has received a service request enables you to measure and document the responsiveness of your team or differentiate performance among your staff.
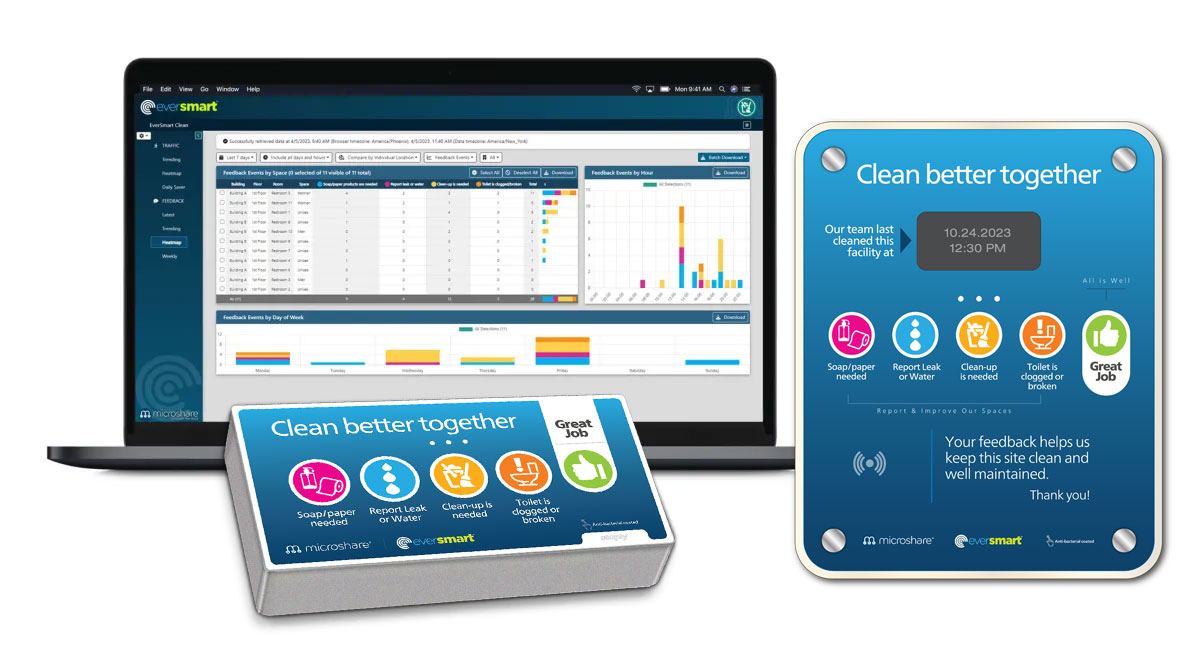
PREDICTIVE DATA: EverSmart’s Feedback Stations empower occupants to be your eyes and ears in the building, providing timely notice of supply issues (need soap/towels) or pose potential problems (toilet overflow, water leak), a key driver of client satisfaction.
TRACK CUSTOMER SATISFACTION: Our feedback stations allow occupants to rate performance, giving you something to follow-up if satisfaction is falling short.
Capabilities
A cleaning operation that responds to the building
Sensors measure the demand signal. The platform turns it into work, and the work into an auditable record you can hand to a client or a regulator.
Occupancy and sensing
People-counting at entrances, corridors and rooms without cameras or personally identifiable data.
Demand-based task queues
Thresholds trigger tasks automatically, so crews always work the highest-impact zone next.
Service-level evidence
Completion, timing and coverage recorded per zone for contract and audit reporting.
Consumable and waste alerts
Bin fill levels and supply status prevent overflow in the spaces visitors see first.
Labor planning insight
Historical demand patterns by hour, day and event type inform shift design and headcount.
Contractor-friendly
Give your cleaning provider scoped access so both sides work from the same numbers.
30%
Typical labor reallocated to high-demand zones
Live
Task lists that update as the building fills
Zero
Paper checklists needed for SLA reporting
Outcomes
What changes in the first quarter
Week 1–2
Sensors installed and baseline demand patterns captured across pilot zones.
Week 3–6
Schedules replaced with triggered tasks; crews stop servicing empty spaces.
Week 7–12
Reporting handed to stakeholders and labor rebalanced against real demand.
Model the savings for your facility
Leave your work email and we'll walk you through a demand-based cleaning model built around your square footage.
Or talk to sales directly